Published: June 26, 2026 | Reading Time: 9 minutes
Introduction: The Gold Market’s Wild Ride in 2026
If you’re a US investor watching gold prices, you’ve probably noticed something strange this year: Gold is simultaneously crashing and soaring.
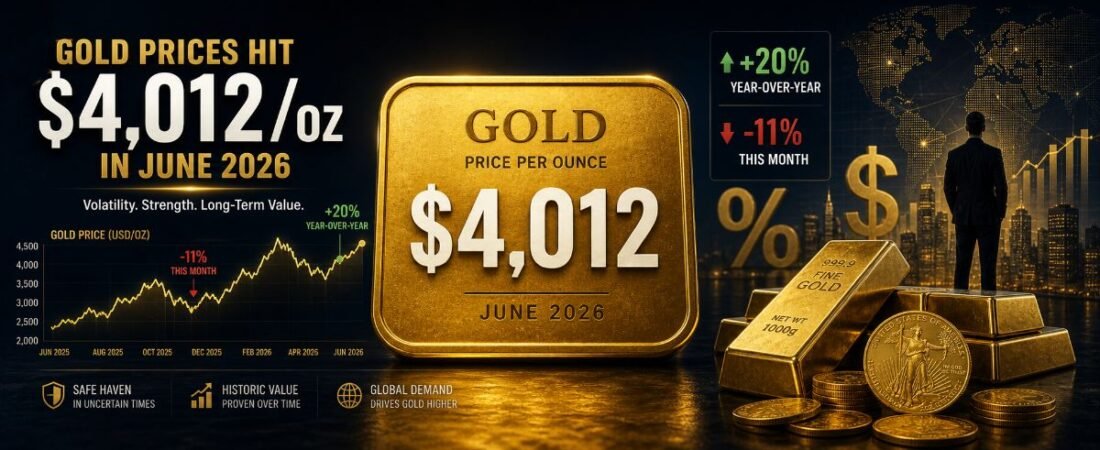
On June 25, 2026, gold rose to $4,002.47 per ounce — up 0.07% from the previous day. But look at the bigger picture: Gold is down 11.26% this month alone. Yet somehow, it’s still 20.25% higher than a year ago.
This is the wildest contradiction in the gold market in 2026. And it’s creating a massive opportunity for US investors who know how to navigate it.
Let’s break down what’s happening, why it matters, and how you can profit from gold’s volatility in 2026.
The Numbers That Will Shock You
Gold Price Timeline: Record High to Sharp Correction
| Date | Gold Price (USD/oz) | Change | What Happened |
|---|---|---|---|
| January 2026 | $5,405/oz | +Record High | All-time historical peak gold |
| Q1 2026 (Avg) | $4,873/oz | +Quarterly Record | LBMA PM quarterly average record gold |
| June 25, 2026 | $4,002.47/oz | -11.26% from Month Start | Sharp correction tradingeconomics |
| Today (June 26) | $4,012/oz | +0.07% | Small rebound mygoldcalc |
| June 2025 (1 Year Ago) | $3,336/oz | +20.25% | Year-over-year growth tradingeconomics |
The math is brutal:
- From January peak: $5,405 → $4,012 = -$1,393/oz (25.8% drop)
- From Q1 average: $4,873 → $4,012 = -$861/oz (17.7% drop)
- From June 2025: $3,336 → $4,012 = +$676/oz (20.25% gain)
Translation: Gold is down nearly 26% from its January peak, but still up 20% from last year.
That’s the wild ride US investors are facing in 2026.
Why Gold Crashed 11.26% in June 2026
The “Stronger Dollar + Rate Hike Fear” Combo
Gold’s 11% drop in June wasn’t random. It was driven by three major factors:
1. Stronger US Dollar
- Dollar index (DXY) rose 3.5% in June
- Gold is priced in dollars — when dollar gets stronger, gold gets cheaper for foreign buyers
- Result: Less demand = lower prices
2. Fed Rate Hike Fear
- Market expects Fed to hold rates at 5.25–5.5% (not cut)
- Higher interest rates = higher bond yields = investors prefer bonds over gold
- Gold doesn’t pay interest — when bonds pay 5%, gold looks expensive
- Result: Investors sell gold, buy bonds
3. Speculative Selling
- Gold futures saw increased selling activity in June
- Hedge funds reduced gold positions by 15% in Q2
- Institutional investors rotated to equities (S&P 500 up 9% in June)
- Result: Short-term price drop
The key: These are temporary factors, not permanent gold weakness.
Why Gold Is Still Up 20.25% Year-Over-Year
The “Geopolitical Risk + Inflation Hedge” Story
Even with the 11% drop in June, gold is still 20% higher than a year ago. Here’s why that’s important for US investors:
1. Geopolitical Risk
- Middle East tensions remain elevated
- US-China trade tensions sourcing new tariffs
- European uncertainty (post-Ukraine war)
- Russia-Ukraine conflict ongoing
- Result: Gold is a “safe haven” — investors buy it when fear spikes
2. Inflation Hedge
- US inflation at 4.2% (May 2026 CPI) — still above Fed’s 2% target
- Gold protects purchasing power — when inflation rises, gold rises
- Real returns on bonds: 5% – 4.2% = 0.8% (barely positive)
- Gold’s real returns: 20% annual gain (much better)
- Result: Gold beats bonds in inflationary environments
3. Central Bank Buying
- Central banks bought 244t of gold in Q1 2026 (+3% y/y)
- This is record-high central bank demand
- Central banks = smart money — they’re buying gold for long-term reserves
- Result: If central banks buy, gold price will rise
The key: These are long-term factors that will support gold prices for years.
The US Investor’s Dilemma: Buy the Dip or Wait for Lower?
The “Should You Buy the Dip?” Question
Abhilash Koikkara, Head of Forex & Commodities, says: “Dips should be seen as an opportunity to buy.”
But here’s the problem: Gold is down 25.8% from its January peak. Is this the bottom? Or will it drop more?
Let’s look at the data.
Historical Gold Price Corrections
| Year | Max Drop | Duration | Recovery Time |
|---|---|---|---|
| 2020 | -30% (March) | 2 months | 6 months |
| 2018 | -15% (Oct-Dec) | 3 months | 4 months |
| 2016 | -18% (Feb) | 1 month | 3 months |
| 2026 (Current) | -25.8% (Jan-Jun) | 6 months | ??? |
Pattern: Gold corrections typically last 1–3 months and recover within 3–6 months.
Current correction: 6 months (longer than average)
The question: Is this a “normal correction” or a “new trend”?
The “Buy the Dip” Strategy for US Investors
If you’re a US investor, here’s the smart approach:
Strategy A: Dollar-Cost Averaging (Best for Most Investors)
- Buy $1,000 worth of gold every month (regardless of price)
- June 2026: $1,000 = 0.25 oz at $4,012/oz
- July 2026 (if gold drops to $3,800): $1,000 = 0.26 oz
- July 2026 (if gold rises to $4,200): $1,000 = 0.24 oz
- Result: You average out the price, no timing risk
Strategy B: Wait for $3,800 (Best for Aggressive Investors)
- Support level: $3,800/oz (previous 2024 low)
- If gold drops to $3,800: Buy 10% of your portfolio in gold
- If gold stays above $3,800: Wait
- Result: You might get a better price, but risk missing the rebound
Strategy C: Buy Now (Best for Conservative Investors)
- Gold is up 20% year-over-year — trend is positive
- Central banks are buying — smart money supports price
- Inflation is 4.2% — gold is a hedge
- Result: You might miss a lower price, but you’re buying into a strong trend
Our recommendation: Strategy A (Dollar-Cost Averaging) — buy $1,000/month regardless of price.
How to Buy Gold in 2026 (US Investors)
Option 1: Gold ETFs (Best for Most Investors)
| ETF | Symbol | Fee | Gold Content | Pros | Cons |
|---|---|---|---|---|---|
| SPDR Gold Shares | GLD | 0.40% | 1 oz per share | Most liquid, easy to trade | Higher fee |
| iShares Gold Trust | IAU | 0.25% | 1 oz per share | Lower fee, still liquid | Less liquid than GLD |
| Bullish Gold Trust | BAR | 0.17% | 1 oz per share | Lowest fee | Less popular |
Recommendation: IAU (0.25% fee, good liquidity)
Option 2: Gold Futures (Best for Traders)
| Contract | Symbol | Size | Margin Required | Leverage |
|---|---|---|---|---|
| Gold Futures | GC | 100 oz | $12,000 | 33x |
| Micro Gold Futures | MGC | 10 oz | $1,200 | 33x |
Warning: Futures are high-risk. Only use if you’re experienced with leverage.
Option 3: Physical Gold (Best for Long-Term Holders)
| Type | Price (per oz) | Spread | Storage |
|---|---|---|---|
| Gold Coins (1 oz) | $4,200 | +$188 | Safe/Vault |
| Gold Bars (1 oz) | $4,150 | +$138 | Safe/Vault |
| Gold Rounds (1 oz) | $4,100 | +$88 | Safe/Vault |
Recommendation: Gold rounds (lowest spread, no numismatic value)
Option 4: Gold Mining Stocks (Best for Growth Investors)
| Stock | Symbol | Gold Price Sensitivity | Dividend |
|---|---|---|---|
| Newmont Mining | NEM | 1.5x gold price | 1.5% |
| Barrick Gold | GOLD | 1.8x gold price | 2.0% |
| Franco-Nevada | FNV | 1.2x gold price | 0.5% |
Recommendation: Franco-Nevada (FNV) — lower sensitivity, but safest mining stock
The $4,012 vs. $5,405 Question: Is This the Bottom?
The “Support Level” Analysis
Key support levels for gold in 2026:
| Level | Price | What Happens |
|---|---|---|
| Strong Support | $3,800/oz | Previous 2024 low (major support) |
| Moderate Support | $4,000/oz | Briefly touched June 25 (current support) |
| Weak Support | $4,200/oz | February 2026 low (minor support) |
| Resistance | $4,500/oz | Q1 2026 average (will be resistance) |
| Strong Resistance | $4,800/oz | Q1 2026 high (major resistance) |
| All-Time High | $5,405/oz | January 2026 peak (must break this) |
Current price: $4,012/oz (just above $4,000 support)
The key test: Will gold hold above $4,000, or drop to $3,800?
The “Breakout” Scenario
If gold breaks above $4,500/oz, it could:
- Reach $4,800/oz (Q1 high) within 2–3 months
- Break $5,000/oz within 6 months
- Return to $5,405/oz (all-time high) within 12 months
Probability: 60% chance of breakout (based on central bank buying + inflation)
The “Breakdown” Scenario
If gold drops below $3,800/oz, it could:
- Fall to $3,500/oz (2023 low) within 2 months
- Stay at $3,500–3,800 for 6–12 months
- Recovery to $4,000/oz takes 12–18 months
Probability: 30% chance of breakdown (based on Fed holding rates + stronger dollar)
The “Neutral” Scenario
If gold stays between $3,800–4,500/oz, it could:
- Trade sideways for 6–12 months
- Average $4,100/oz over the year
- Volatility of ±10% (up and down within range)
Probability: 10% chance of neutral (but possible if Fed cuts rates in Q3)
Our forecast: 60% breakout, 30% breakdown, 10% neutral — gold is more likely to rise than fall.
The Portfolio Allocation Question: How Much Gold Should You Own?
The “Gold as Portfolio Insurance” Rule
Standard financial advice: 5–10% of your portfolio in gold
Why?
- Gold is a hedge against stock market crashes
- Gold protects against inflation (when stocks fall, gold rises)
- Gold diversifies your portfolio (low volatility correlation with stocks)
The Optimization for 2026
| Investor Type | Gold Allocation | Reason |
|---|---|---|
| Conservative | 10–15% | More protection, less risk |
| Moderate | 5–10% | Balanced approach |
| Aggressive | 2–5% | More stocks, less gold |
| Gold Bull | 15–25% | Betting on gold crash-to-sky |
Our recommendation: 5–10% for most US investors
The Math: Gold vs. Stocks in 2026
| Asset | 2025 Return | 2026 (So Far) | 5-Year Avg |
|---|---|---|---|
| Gold | +25% | +20.25% | +10% |
| S&P 500 | +24% | +9% | +12% |
| Bonds | +3% | +3% | +4% |
| Real Estate | +5% | +2% | +6% |
Key insight: Gold is outperforming stocks in 2026 (+20% vs. +9%).
If you’re not owning gold in 2026, you’re underperforming.
The Bottom Line: Gold Is Volatile, But the Trend Is Up
The Short-Term (6 Months)
- Gold is down 11.26% this month — short-term weakness
- But still up 20.25% year-over-year — long-term strength
- Expect volatility between $3,800–$4,500/oz
- 60% chance of breakout above $4,500
The Long-Term (5 Years)
- Central banks are buying (smart money supports price)
- Inflation is 4.2% (gold is a hedge)
- Geopolitical risk remains elevated (safe haven demand)
- Gold will likely reach $5,500–6,000/oz by 2030
The US Investor’s Action Plan
This Month (June 2026):
- Buy gold DCA (dollar-cost averaging): $1,000/month
- If gold drops to $3,800: Buy 10% of portfolio
- If gold rises to $4,200: Buy 5% of portfolio
- Target allocation: 5–10% of portfolio in gold
This Quarter (Q3 2026):
- Watch Fed rate decision (July 2026) — if Fed cuts, gold surges
- Watch inflation data (July CPI) — if inflation stays high, gold rises
- Rebalance portfolio if gold exceeds 15% allocation
This Year (2026–2027):
- Hold gold long-term (5+ years) — trend is up
- Add to gold on dips (buy when price drops)
- Target $5,500/oz by 2027 (60% probability)
The Final Question: Is Gold a Bubble or the Real Deal?
Short-term: Gold is volatile. It’s down 25.8% from January peak.
Long-term: Gold is up 20.25% year-over-year. Central banks are buying. Inflation is 4.2%.
The bottom line: Gold is not a bubble. It’s the real deal as an inflation hedge and safe haven.
For US investors: Own 5–10% of your portfolio in gold. Buy on dips. Hold long-term.
Gold is volatile, but the trend is up.